

GREEN DATA
2019 – Present
Our mission is to merge students' passion for environmentalism with their interest in data science in order to develop skills and use empirical data to tackle issues of sustainability. Using this analytical perspective and skillset, we aim to produce results that have a tangible impact on UChicago and the community at large.
UChicago Dining reached out to Green Data in Autumn 2022 to conduct analysis on their current eco-digesters and provide alternatives.
Eco-Digesters
Campus Waste Reduction Survey Data Analysis
CWR conducted two waste audits through surveys (in 2021 and 2022) about access to recycling, and they want to use this data to publish an article in a local newspaper about access to recycling in Hyde Park and how this access varies across property management companies.
We are conducting data analysis on survey responses in order to gather relevant findings for the article by looking into spatial analysis on qgis and access to recycling by color (recycling presence/absence, usage, etc.). We are continuing to work on sizing and coloring the spatial data analysis and will further look into the implications of the data for off-campus residential recycling programs.

Divvy Ride Data Analysis
We analyzed 10 years of Divvy usage data within Hyde Park to advocate for an expanded Divvy bike share program on campus via a subsidy in the style of the Lyft Ride Smart program.
We cleaned public-use data on Divvy bike rides from 2013-2022 (including an over 120,000-observation subset of rides near Hyde Park in 2021), weather data, and rideshare data. We also researched Divvy bike pricing and subsidy programs at 10 Chicago colleges. With our cleaned data, we produced several analyses of Divvy ridership in Hyde Park in 2021, including ride volume across months, times of day, and weather conditions by both membership and bike type. We also surveyed 100 students to understand students’ cycling habits and needs in order to compile evidence for a subsidized Divvy program.
With our Divvy data and survey responses, we met with the UChicago Transportation Department alongside PSI's Green Partnerships, where we used our findings to show that UChicago students would be interested in a reduced or free Divvy membership provided by the University.
As a result of this data analysis, the Transportation Department was interested in implementing a Divvy program, possibly in the form of a hybrid Lyft/Divvy Pass Program, as a solution to the lack of financial and environmental sustainability of the current Lyft 10-Ride Pass program. We are awaiting more information from the Transportation Department in order to conduct a second survey about whether students would be interested in being able to use Divvy as part of their 10 free Lyft rides.
With PSI's 10th birthday coming up in April 2023, Green Data is working to organize and visualize historical PSI event attendance data and improve current data collection methods.
In order to better quantify results and long-term impact, Green Data is now aiming to collect data on all PSI events. This data can be used for quarterly reports and displayed on the PSI website. We collected and visualized attendee data for two events organized by Community Action and Public Engagement, and we developed 3 concrete data collection ideas for long-term events and projects to be implemented next quarter.
PSI Data Analysis
Environmental Frontiers Data Transparency
We are collaborating with the Environmental Frontiers Project from the Mansueto Institute of Innovation in order to improve the University’s data transparency by producing a centralized energy dashboard that compiles sustainability data.
We produced a rubric to evaluate 23 other higher education institutions' dashboards based on accessibility, design, and other variables. We then created and distributed a survey to the UChicago community asking them to assess UChicago and other institution's dashboards. Using our survey responses and our own evaluation, we met with Facilities to share findings, propose solutions, and centralize our work.

Partnership with Urban Rivers
We established a partnership with Urban Rivers, a Chicago-based nonprofit working to build the Wild Mile (a conversion of unused industrial canals into ecological sanctuaries). Our project created data visualizations for scientific and public audiences and provided data organization recommendations
We used Urban Rivers’ fish survey data set to assess fish diversity along several regions of the Chicago River in order to study the impact of the Wild Mile and floating eco-parks, communicating our findings in a presentation that will be utilized by Urban Rivers in future presentations with community stakeholders


Dining Hall Survey
We partnered with Campus Waste Reduction to administer a survey to on-campus students about food waste and utilization of single use takeout containers in the dining halls due to the pandemic-related changes in dining procedures. This data and analysis contributes to Campus Waste Reduction's efforts to make UChicago Dining more sustainable.
When carrying out food from UChicago Dining Halls, students are provided with non-biodegradable containers, plastic bags, and plastic utensil sets. Our survey and analysis found that most students use multiple disposable material types multiple times a day.

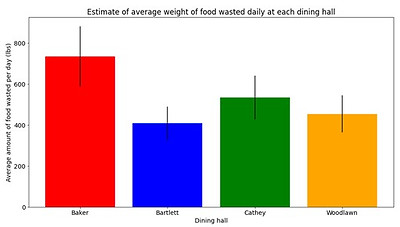
Estimates of food waste at each dining hall, based on the assumptions of 500 people eating at each dining hall every day, and that a box contains roughly 1.33 pounds of food. Error bars depict the range of values resulting from varying the assumed number of people at each dining hall from 400 to 600. Total estimated food waste on campus per day is upwards of 2000 pounds.

Solar Energy Guidance on Campus
Green Data, in aims to provide data-supported guidance to University leaders, produced a comprehensive list of potential energy production and cost savings due to solar installations on the University buildings we determined to be the most suitable for generating solar energy.
We compiled our calculations into a formal report which we hope will inform the College’s renewable energy efforts as they work towards meeting their emissions reduction goals. Our next step is to present our findings to the Office of Sustainability and other University leaders to encourage expanding the University’s use of solar energy on campus.
Chicago Water Quality
Through research, we identified the chemicals that we expect to find in Chicago drinking water and isolated lead (Pb) and hexavalent chromium (Cr-6). We then decided to take water samples from select North, South, West, and Central neighborhoods after researching demographics about these neighborhoods, including trends in average household income, average age, race distribution, land use, and history of water contamination.
Pollution and Covid-19
We created trend pollution maps graphs of 3 cities before and during the onset of Covid-19. In addition we analyzed the relationship between air pollution and Covid-19 death rates in Chicago’s 77 community areas. We created choropleth maps depicting both of these variables and performed calculations to determine potential correlations between air pollution and Covid-19 death rates throughout the city.
Presenting Our Data
In December 2021, we gave a 20-minute presentation to all of PSI to showcase the skills we’ve learned in R and to provide relevant insight into UChicago’s progress towards their emissions reduction goals. We also presented our work to UChicago President Alivisatos at the inaugural Sustainability Town Hall.

Green Data presents "Energy Usage at UChicago" at PSI's general meeting. These presentations contribute to PSI's "Member Talks" series.
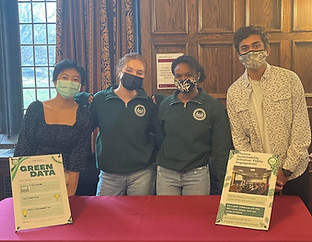
PSI members stand in front of Green Data's poster (left) at the Sustainability Town Hall.
